Gold Price Forecast: Technicians are monitoring for signs of a deceleration of the bullish correction
- Gold bears are monitoring for a deceleration in the bullish correction, now at critical resistance.
- The 4-hour time frame offers a compelling picture of the market structure.
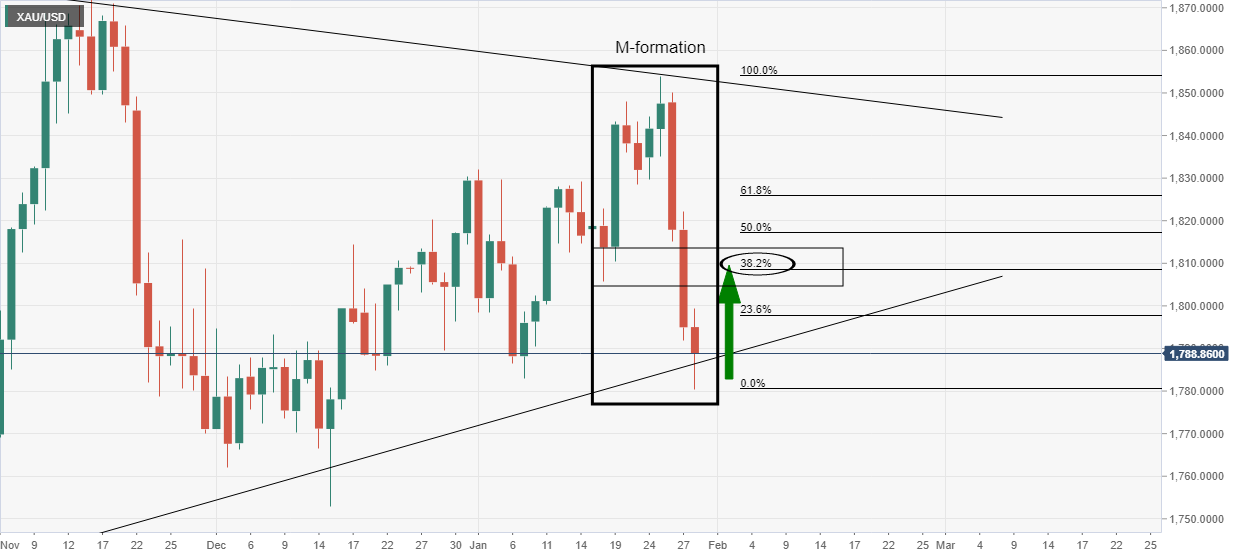
As per the Chart of the Week analysis, the daily M-formation that was noted has played out as follows.
It was stated that ''considering the trendline support and the daily M-formation, the technicians would argue that a significant correction of the bearish impulse could be in play...''
Gold, daily chart prior analysis
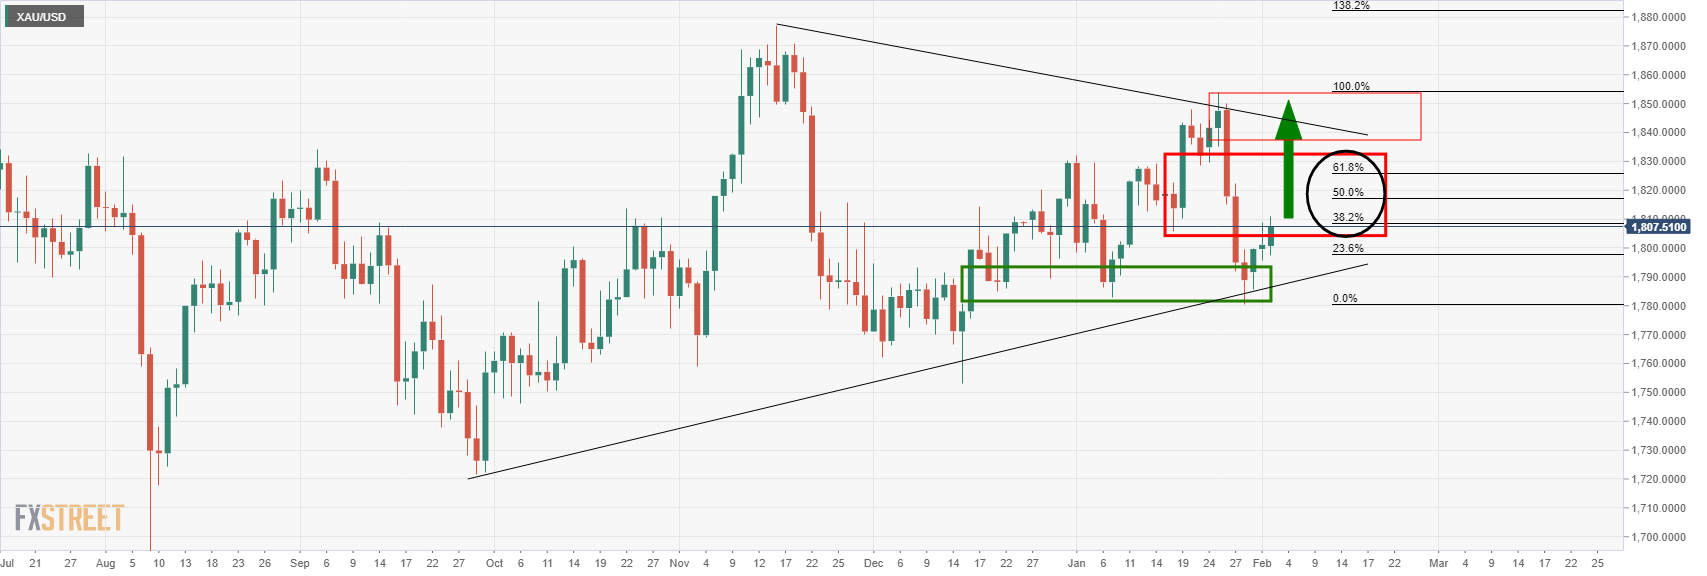
In the case above, the 38.2% Fibonacci retracement level near $1,810 was the initial target area that had a confluence with prior structure as illustrated.
Gold, live market
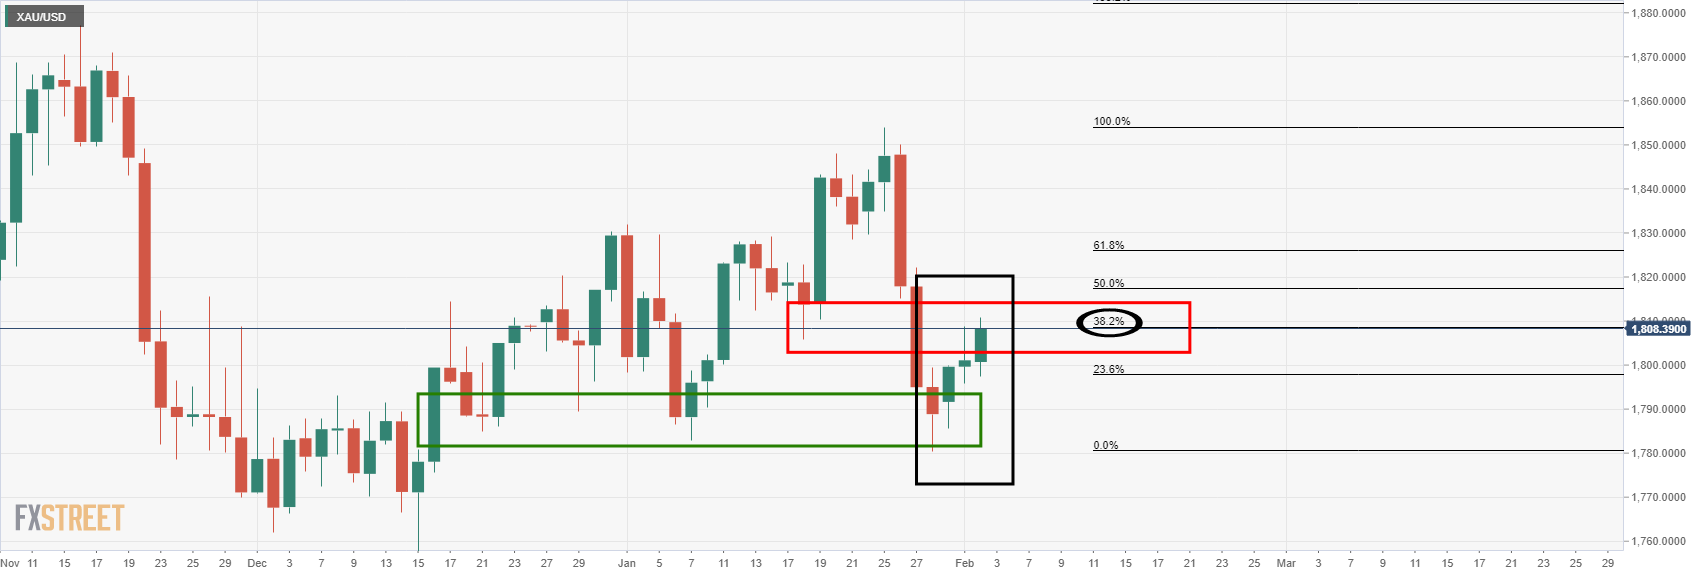
So far so good.
What bears will now want to see is a deceleration in the price action. This can be monitored from a lower time frame, such as the 4-hour chart:

In the above chart, we can see a number of interesting structures that leave a bearish bias below the $1,820's. The price would be expected to move lower to test the W-formation's neckline near $1,802 as follows:

As stated at the start of the week's analysis in the Chart of the Week, ''should this playout, and if the bears commit ... additional supply could be the straw that breaks the camel's back for a sizeable continuation to crack the trendline support as follows:

On the other hand, if the US dollar gives way again, then the neckline of the M would be the last defence for a restest of the wedge resistance the $1,850's once again: