AUD/USD Price Analysis: Bulls and bears battle it out between key levels
- AUD/USD remains trapped between key SMAs on hourly sticks.
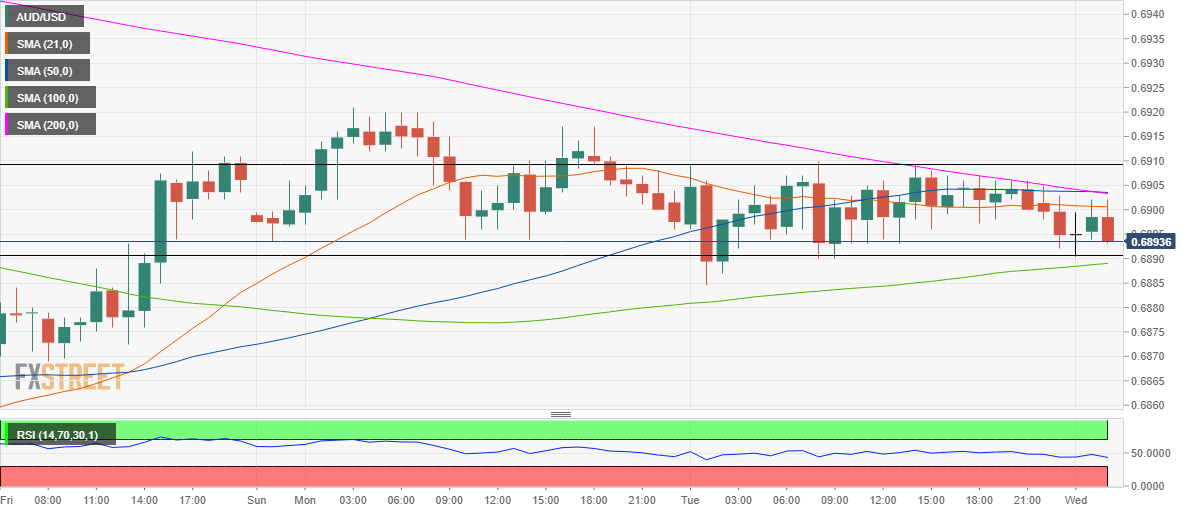
- The Relative Strength Index (RSI) has turned flat at the mid-line.
- All eyes on US-China phase one trade deal details for fresh directives.
AUD/USD extends its overnight side trend around the 0.6900 level into Wednesday’s Asian trading, as markets await the details of the US-China phase one trade deal for the next direction in the spot.
The US Treasury Secretary Mnuchin said earlier today that the US-China trade deal is fully enforceable and that the trade deal documents will be released on Wednesday.
From a technical perspective, the Aussie looks to extend the range play as long as a tug of war continues between the bulls and bears between the key Hourly Simple Moving Averages (HMA).
The confluence of bearish 200-HMA and horizontal 50-HMA around 0.6905 caps the upside attempts while to the downside the upward sloping 100-HMA lends some support to the bulls. This arrangement has locked the rates in a rectangle pattern, with a strong catalyst awaited for a breakout in either direction.
The hourly RSI has turned flat, right at the midline, backing the case for the range trade to continue in the near-term.
The downside appears more compelling for the Aussie, as it lacks significant support levels if the 0.6890/85 demand area is caved in.
AUD/USD 1-hour chart
AUD/USD Key technical levels