GBP/USD Technical Analysis: Heavy below 21-day SMA, monthly resistance trendline
- GBP/USD sellers catch a breath after a three-day losing streak.
- Ascending trend line since early-November gains short-term sellers’ attention.
- A confluence of 200-day SMA, 61.8% Fibonacci retracement becomes the strong support.
GBP/USD stays modestly changed to 1.3070 amid the initial trading session on Friday. That said, the pair slipped below 21-day SMA on Thursday while posting consecutive third negative daily closing.
Sellers are now gearing up for an upward sloping trend line since November 08, at 1.2965. However, 38.2% Fibonacci retracement of October-December upside, at 1.3010 can offer immediate rest-point.
If at all the Bears dominate past-1.2965, late-November lows near 1.2820 can offer intermediate halts prior to dragging the GBP/USD prices towards a confluence of 200-day SMA and 61.8% Fibonacci retracement near 1.2700/2690.
Alternatively, a 21-day SMA level of 1.3103 and a four-week-old descending trend line close to 1.3160 should restrict the pair immediate recovery.
If not, then 23.6% Fibonacci retracement around 1.3200 and late-December tops near 1.3285 will gain the buyers’ attention.
GBP/USD daily chart
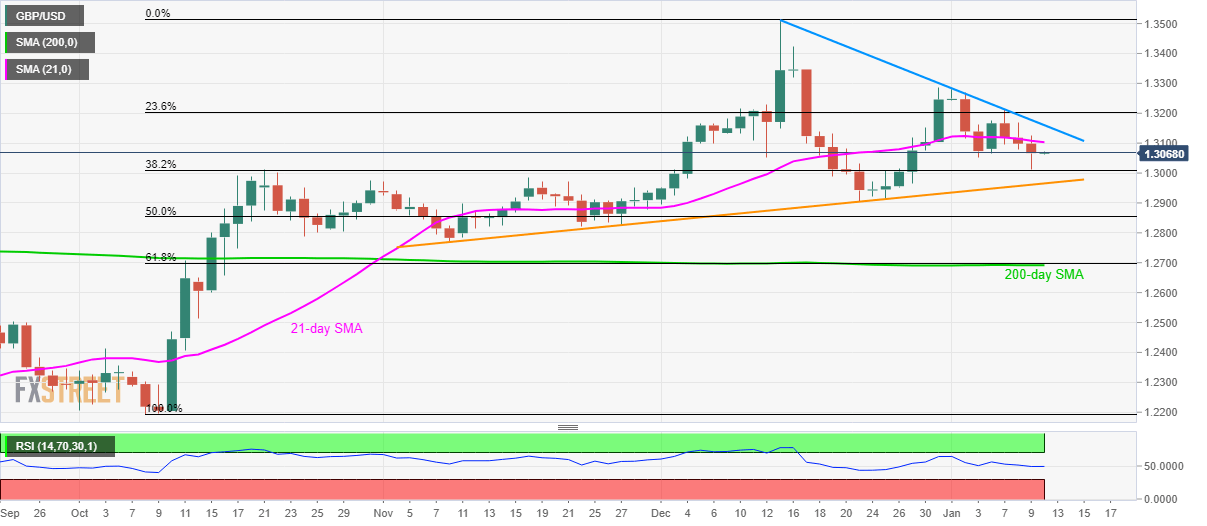
Trend: Bearish