Back
8 Jan 2020
USD/INR Price Analysis: Greenback reverses down vs. Indian rupee, trades near 71.40 level
- USD/INR sellers are eying the December lows.
- The level to beat for bears is the 71.20 support.
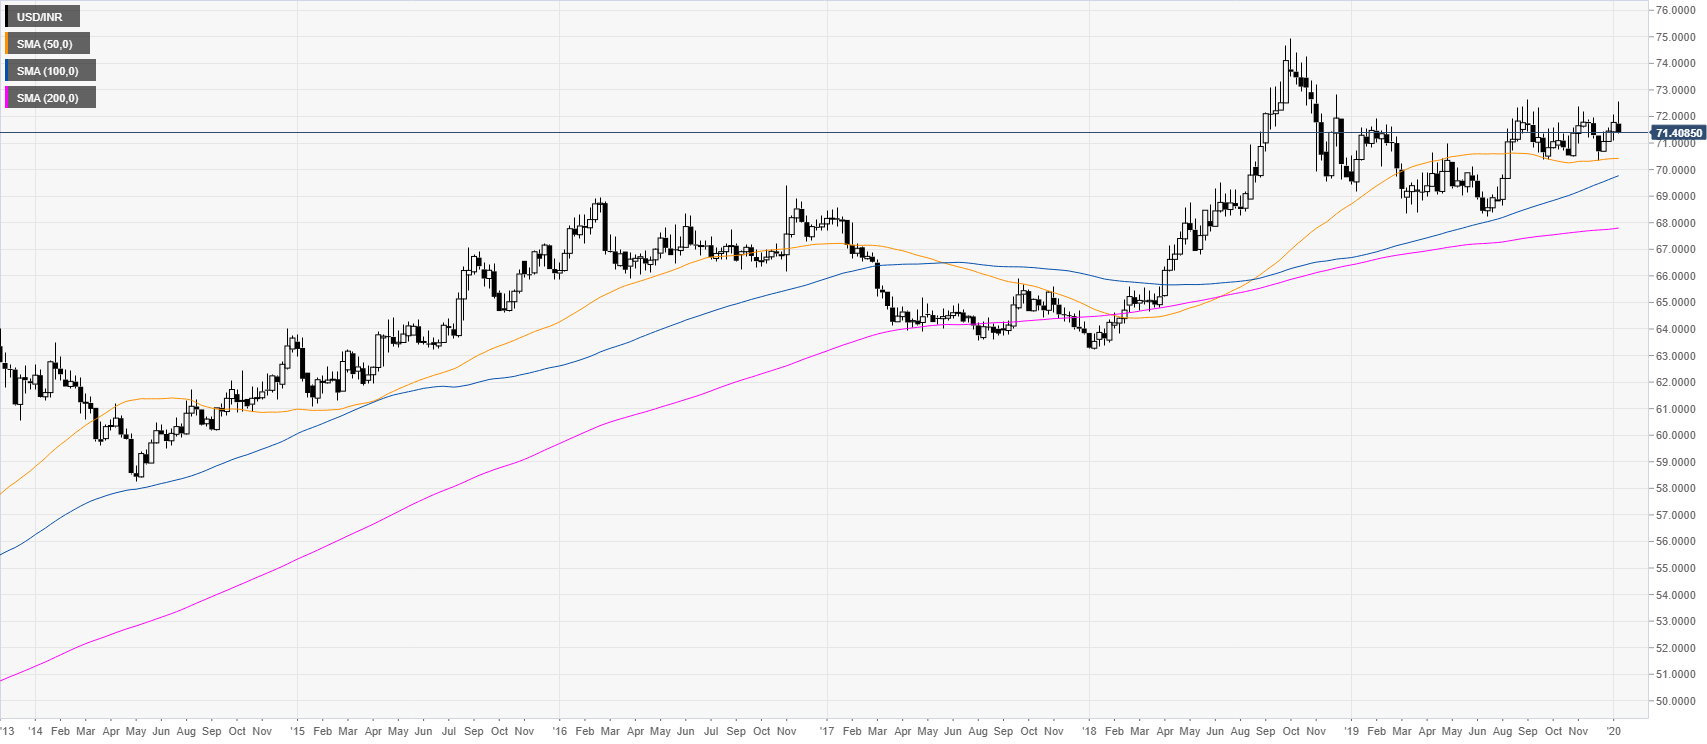
USD/INR weekly chart
USD/INR is trading in a rectangle consolidation while above the main weekly simple moving averages (SMAs).
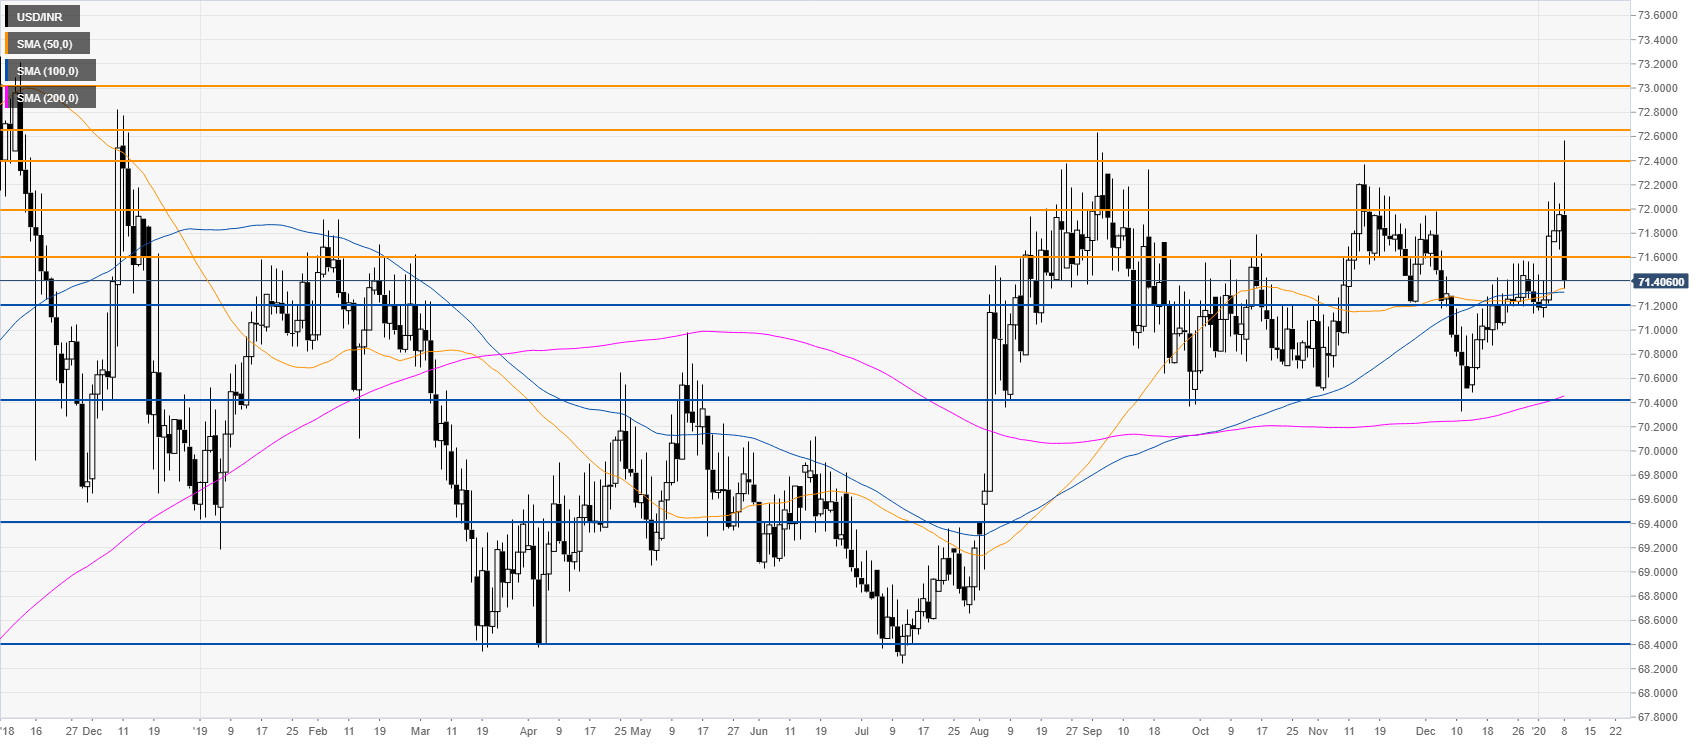
USD/INR daily chart
The spot is trading in a rectangle formation while in the 70.40-72.40 range as it is holding above the main daily simple moving averages (SMAs). As the market is rejecting the 72.65 level and reversing from the highs, the spot could extend its downfall after a break of the 71.20 support. Further down, lies the 70.40 level.
Additional key levels